Interactive infographics

Interactive infographics for the Central Government
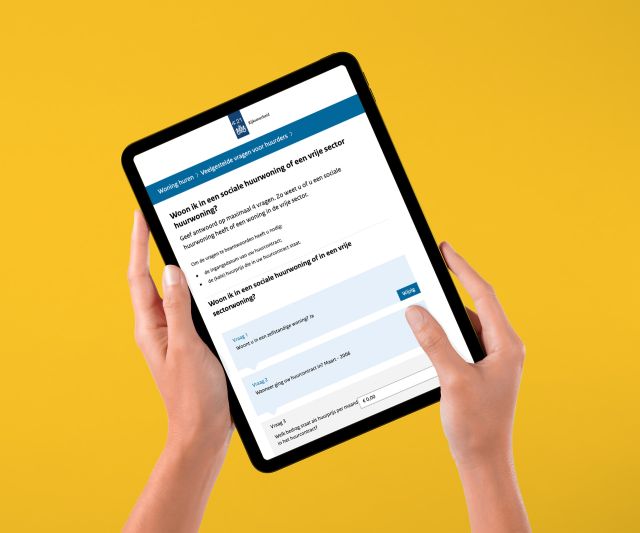
Within the various ministries, there is a great need for tooling to present complex issues in a simple and user-friendly way. Questions such as "Do I live in a social rental property or a free sector rental property?" or "What is my gross minimum wage?" are complex to answer textually. Through question-driven interactive web components, we can answer these questions simply and on the person.
What is an interactive infograhic?
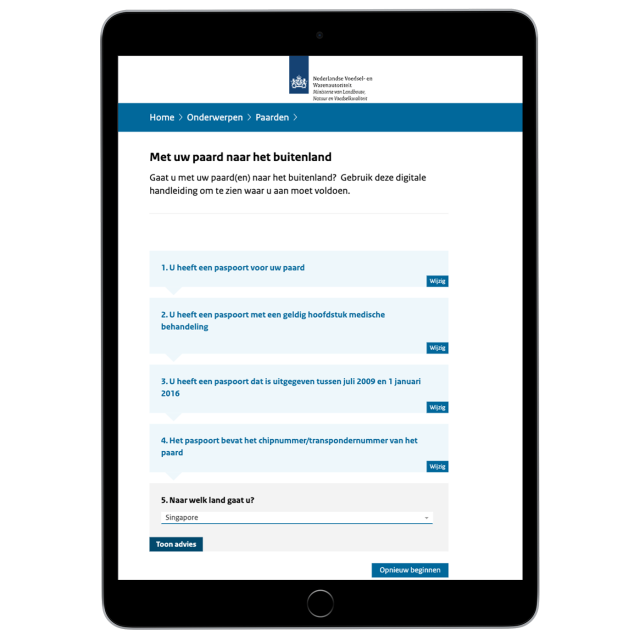
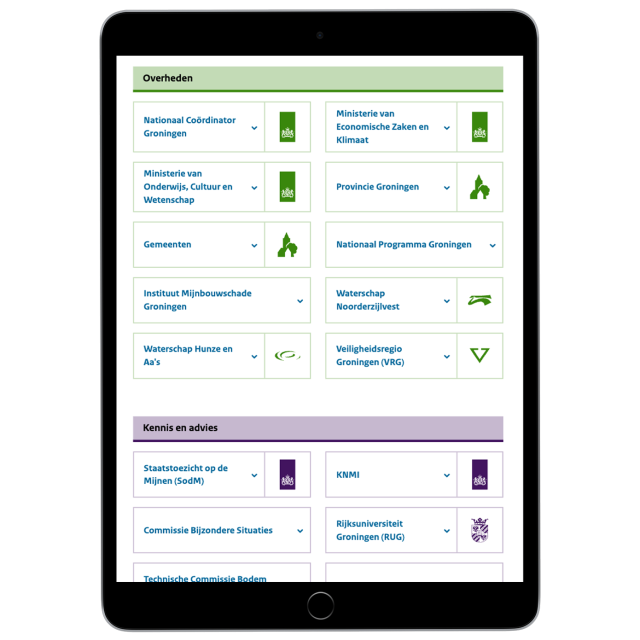
An interactive infographic unlocks complex information by displaying it graphically and in which a user can call up additional information or a calculation through interaction (e.g., a click). For example, an interactive infographic can contain geographical information, but also a summary or explanation of a process, a development or a complex dataset (think minimum wage tool, for example).
The main advantage of using an interactive infographic is that it makes it possible to offer approachable complex information or calculations to the end user or visitor. By offering questions or information in phases, the visitor is not overstimulated and the information remains understandable.


Want to know more about interactive infographics?

Do you have a question about interactive infographics or web components or would like a no-strings attached sparring session?